US county maps, and the data behind them
All 3,144 counties and county-equivalents, each with its real boundary, its current figures, and a citation for every number. Start with a state.
Population from the Census Bureau's Vintage 2025 estimates. Land area from the 2025 Gazetteer. Rebuilt 30 August 2026.
- Population
- Land area
- Divided into
Browse by state
Every state page carries an interactive map, a sortable table of all its counties, and printable map files. Ordered by population.
- California58 counties
- Texas254 counties
- Florida67 counties
- New York62 counties
- Pennsylvania67 counties
- Illinois102 counties
- Ohio88 counties
- Georgia159 counties
- North Carolina100 counties
- Michigan83 counties
- New Jersey21 counties
- Virginia133 counties and independent cities
- Washington39 counties
- Arizona15 counties
- Tennessee95 counties
- Massachusetts14 counties
- Indiana92 counties
- Missouri115 counties
- Maryland24 counties
- Colorado64 counties
- Wisconsin72 counties
- Minnesota87 counties
- South Carolina46 counties
- Alabama67 counties
- Louisiana64 parishes
- Kentucky120 counties
- Oregon36 counties
- Oklahoma77 counties
- Connecticut9 planning regions
- Utah29 counties
- Nevada17 counties
- Iowa99 counties
- Arkansas75 counties
- Kansas105 counties
- Mississippi82 counties
- New Mexico33 counties
- Idaho44 counties
- Nebraska93 counties
- West Virginia55 counties
- Hawaii5 counties
- New Hampshire10 counties
- Maine16 counties
- Montana56 counties
- Rhode Island5 counties
- Delaware3 counties
- South Dakota66 counties
- North Dakota53 counties
- Alaska30 boroughs and census areas
- District of Columbia1 county-equivalent
- Vermont14 counties
- Wyoming23 counties
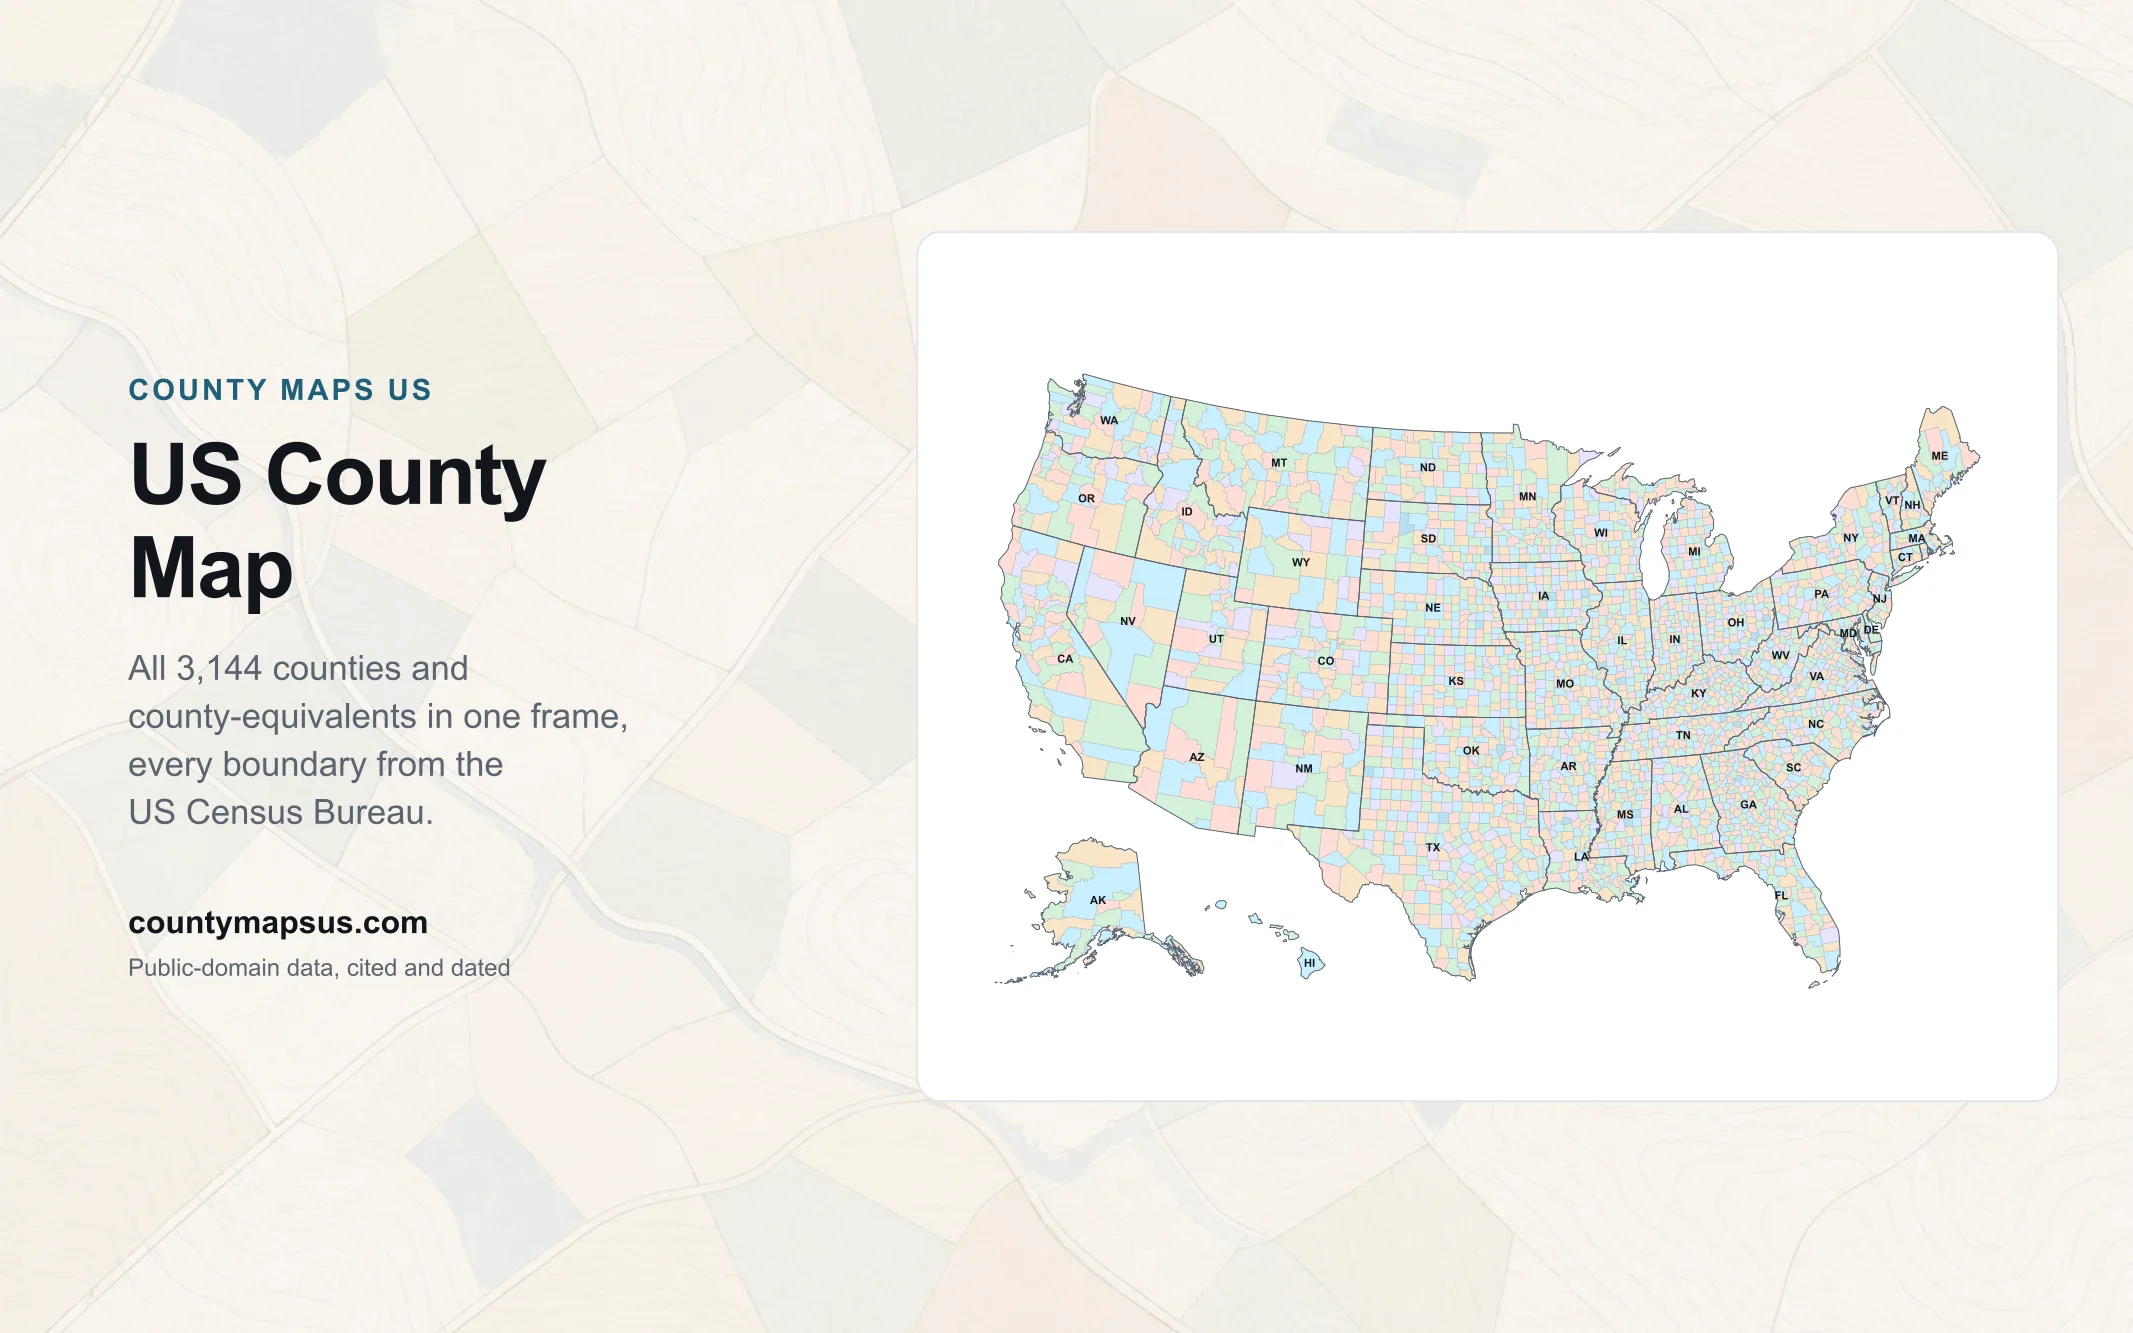
The whole country in one frame
All 3,144 counties on a single labelled map, drawn from the Census Bureau's 2025 cartographic boundary files. The same map is free to download as SVG, PNG or a print-ready PDF.
Not every county is a county
The United States has 3,144 county-equivalents across nine different legal types. 35 of them have no county government at all. Templates that assume otherwise get those pages wrong, so this site records the legal type of every entity and says what it means.
- 2,999counties
- 64parishes in Louisiana
- 40independent cities
- 13boroughs in Alaska
- 11census areas in Alaska
- 9planning regions in Connecticut
- 4cities and boroughs in Alaska
- 2municipalities in Alaska
- 2entities with no legal type word at all
Why the count is not a round number, and which places have no county government.
Answers people look for
All 12 rankings, or the complete sortable tables of every county by population, area and income.
Explainers
About this US county map
The interactive US county map on this site draws all 3,144 counties and county-equivalents from the Census Bureau's 2025 cartographic boundary files. Every shape on it is a link, every name is printed on the map rather than hidden behind a hover, and every number attached to it carries the Census product it came from and the year that product was published. This page is the entry point; the state pages are where the detail lives.
An interactive map with every county named
Names are printed directly on the map. That sounds obvious and is not how most county maps work: the common approach is an unlabelled shape that gives up a name only when a pointer touches it, which fails on a phone, fails for anyone using a keyboard, and fails when the page is printed. Here the label layout is computed when the site is built and sized against how many counties a state holds, so Texas at 254 does not print at the size Delaware at 3 does. Where two labels would collide, the one with less room shrinks or steps aside instead of overlapping. A name that still does not fit is dropped from the map and kept in the sortable table below it, so nothing is available only to a mouse.
The map is server-rendered SVG. It is complete before any script runs, which means it works with JavaScript blocked, it shifts nothing as the page loads, and it costs no extra request. Script adds two things and only two: a tooltip carrying the county's figures, and the switch that repaints the map by population, density or median household income.
Blank, fillable and colourable versions
Every map here is downloadable, and each comes in a labelled cut and a blank one. The blank US county map is the same geometry with the names taken off: outlines only, nothing else on the sheet.
The SVG is the file to take if you intend to edit it. It opens in Illustrator, Inkscape, Figma and Affinity, every county is a separate path carrying its FIPS code as its id, and the fills are plain attributes. That is what makes it a fillable US county map in the practical sense: you can select one county, change its colour, and affect nothing else on the page. Colouring counties by hand is how most thematic maps actually get made, and starting from a correct boundary file removes the part of that job that is genuinely hard.
The blank PNG is the one to print and colour in. It is 2000 pixels wide, which is enough to fill a US Letter or A4 sheet edge to edge without the lines going soft.
High resolution and print
Three formats ship for every map. The SVG is vector and has no resolution at all, so it scales to a wall poster without degrading. The PNG is a 2000 pixel raster for the cases where a vector will not do. The PDF is laid out for US Letter and is ready to send to a printer as it is.
All of it is free to use and redistribute. The boundaries are public-domain works of the United States federal government, so there is no licence to accept and no attribution required, though a credit is appreciated.
The data behind 3,144 counties
A map carrying no data is a picture. Every county on this one opens to a page with its population and the change since 2020 broken into births, deaths and net migration; its land area, water area and total area; its population density, computed here from two different Census products and labelled as computed; its median household income, home value and age; its county seat and founding year; and every county it borders, ordered by the length of the border they actually share.
That last one is worth naming, because the Census Bureau publishes county adjacency and almost nobody surfaces it. Knowing two counties touch is one fact. Knowing they touch along 47 miles rather than at a single point is a different one, and it is sitting in the file.
Cities and county seats
Each county page marks its county seat with a dot placed from the 2025 Census Gazetteer, and names the largest incorporated place inside the county with its population. Where that place spills across the county line, the page says so rather than implying the whole population sits inside.
This is not a road map. It shows administrative boundaries and the settlements that govern them, which is a different thing from a map of where people drive.
What these maps do not show
Being straight about the gaps costs less than disappointing someone after a download. These maps carry no highways, no roads and no terrain. They carry no election results, so they will not tell you how a county voted. There is no quiz mode and no map maker: this site publishes finished maps and the data behind them, it does not host a tool for assembling one from scratch. If what you want is a base layer to build something on, the blank SVG is the file to take.
Where to start
If you know the state, start there: every state page carries its own interactive map, a sortable table of all its counties, and its five downloads. If you want the whole country at once, the US county map page has the national frame and its printable files. If you are weighing two places against each other, the comparison tool draws both at true relative size on the same measures.
Frequently asked questions
How many counties are on a US county map?
A complete US county map shows 3,144 counties and county-equivalents. The figure is not a round 3,000: it depends on whether you count Alaska's census areas, Virginia's 38 independent cities and Connecticut's nine planning regions, all of which the Census Bureau treats as county-equivalents. This site maps all 3,144.
Is there an interactive US county map with names?
Yes. Every state map here prints county names directly on the map instead of revealing them on hover, and each shape is a link to that county page. The map is server-rendered, so the names are present before any script runs and stay in the page when it is printed.
Where can I get a blank US county map?
Every map on this site has a blank cut with the names removed, free to download as SVG or PNG. The blank PNG is 2000 pixels wide for printing and colouring in; the blank SVG is vector and keeps every county as a separate path.
Is the US county map editable or fillable?
The SVG downloads are editable in any vector editor. Each county is its own path carrying its FIPS code as an id, so you can select a single county, fill it with a colour, and affect nothing else. That is what makes it usable as a fillable base for a thematic map: you fill in one county at a time and nothing bleeds into its neighbours.
Is there a colorable US county map?
Yes. Every map has a blank cut carrying no names. The blank PNG is 2000 pixels wide and prints cleanly on US Letter or A4 for colouring in by hand; the blank SVG is the one to colour in software, since each county is a separate path you can fill on its own.
Can I download a US county map PDF?
Yes. Every state has a print-ready PDF laid out for US Letter, and so does the national map. They are free to download and free to redistribute, with no account and no licence to accept.
Is there a US county map shapefile?
Not from this site directly. The downloads here are SVG, PNG, PDF and CSV. What this site does publish is TopoJSON for the nation and every state under /geo/, which mapshaper or ogr2ogr will convert to GeoJSON or to a shapefile in a single command. The original shapefiles are the Census Bureau 2025 cartographic boundary files, which is the same source these maps are drawn from.
Can I use these county boundaries in Google Maps?
Not as a ready-made layer. These are static maps rather than a Google Maps overlay, and this site publishes no KML. The TopoJSON under /geo/ converts to GeoJSON, which Google My Maps will import, and the underlying boundaries are the Census Bureau cartographic files if you would rather start from the source.
Can I get a high resolution or printable US county map?
Yes. Every map ships as a vector SVG, which has no fixed resolution and scales to any size, as a 2000 pixel PNG, and as a print-ready PDF laid out for US Letter.
Is there a US county map with cities?
It marks county seats and names the largest incorporated place in each county with its population. It does not plot every city, and it is not a road map.
Does the US county map include highways or election results?
No. These are administrative boundary maps built from Census Bureau files. They carry no highways, no roads and no election data.
Can I use these US county maps commercially?
Yes. The boundaries are public-domain works of the United States federal government, so the maps are free to use, modify and redistribute, including commercially. Attribution is appreciated but not required.
Where does the county boundary data come from?
Boundaries come from the Census Bureau 2025 cartographic boundary files, generalised so that no point moves more than half a pixel at the width shown. Population is from the Vintage 2025 estimates, land area from the 2025 Gazetteer, and income from the American Community Survey. Every figure on the site names its source and its vintage.
Sources: US Census Bureau, Population Estimates Program, Vintage 2025 Population Estimates, released 26 March 2026; US Census Bureau, Gazetteer Files, 2025 Gazetteer Files, released 10 September 2025; US Census Bureau, American Community Survey, American Community Survey 2020-2024 5-Year Estimates, released 29 January 2026; US Census Bureau, County Adjacency File, 2025 County Adjacency File, released 15 September 2025. Retrieved 30 August 2026.