Minnesota County Map
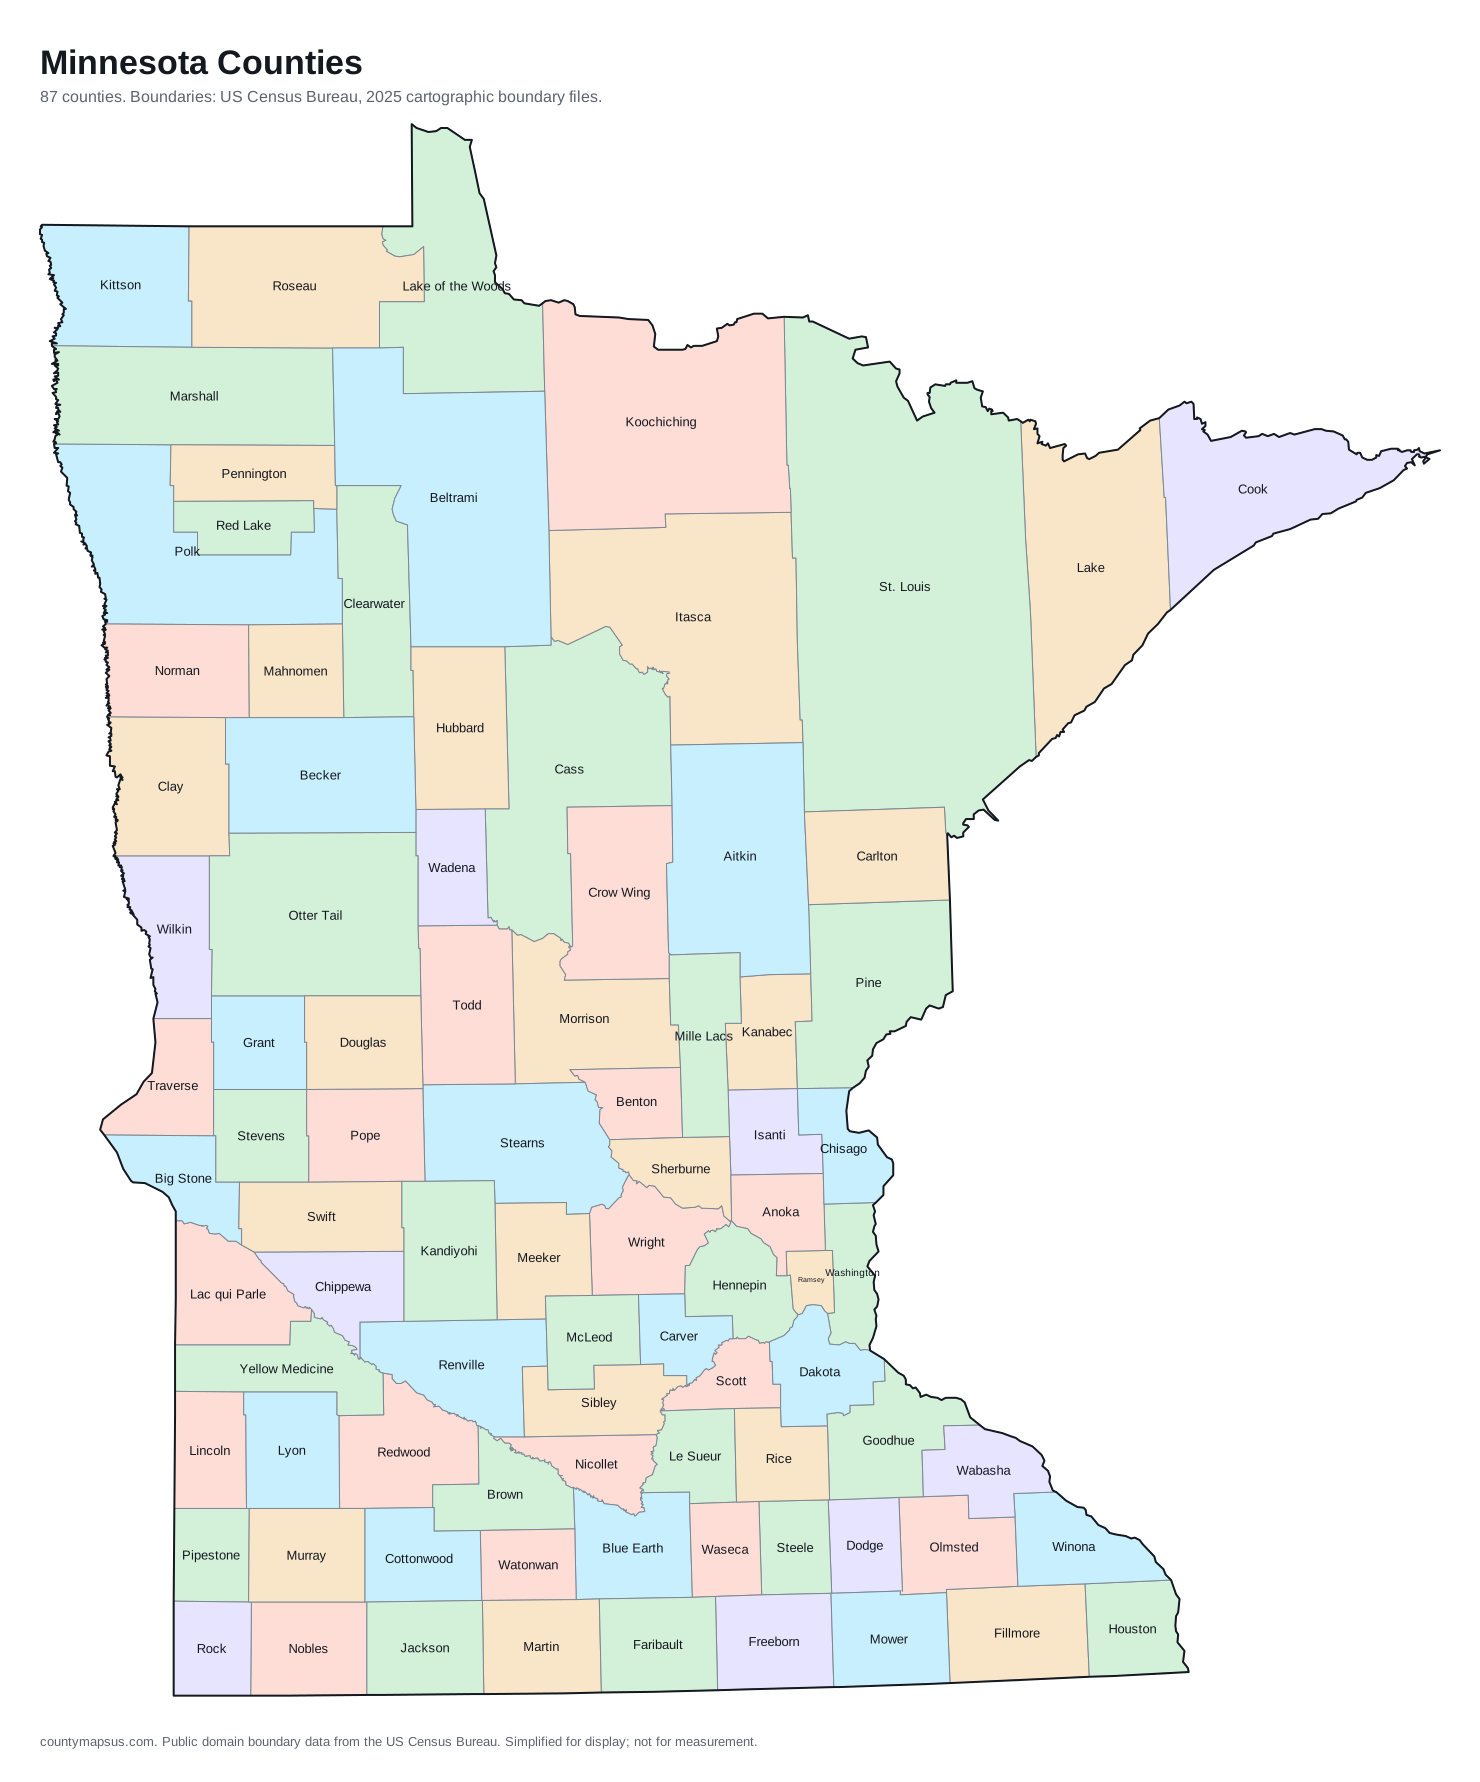
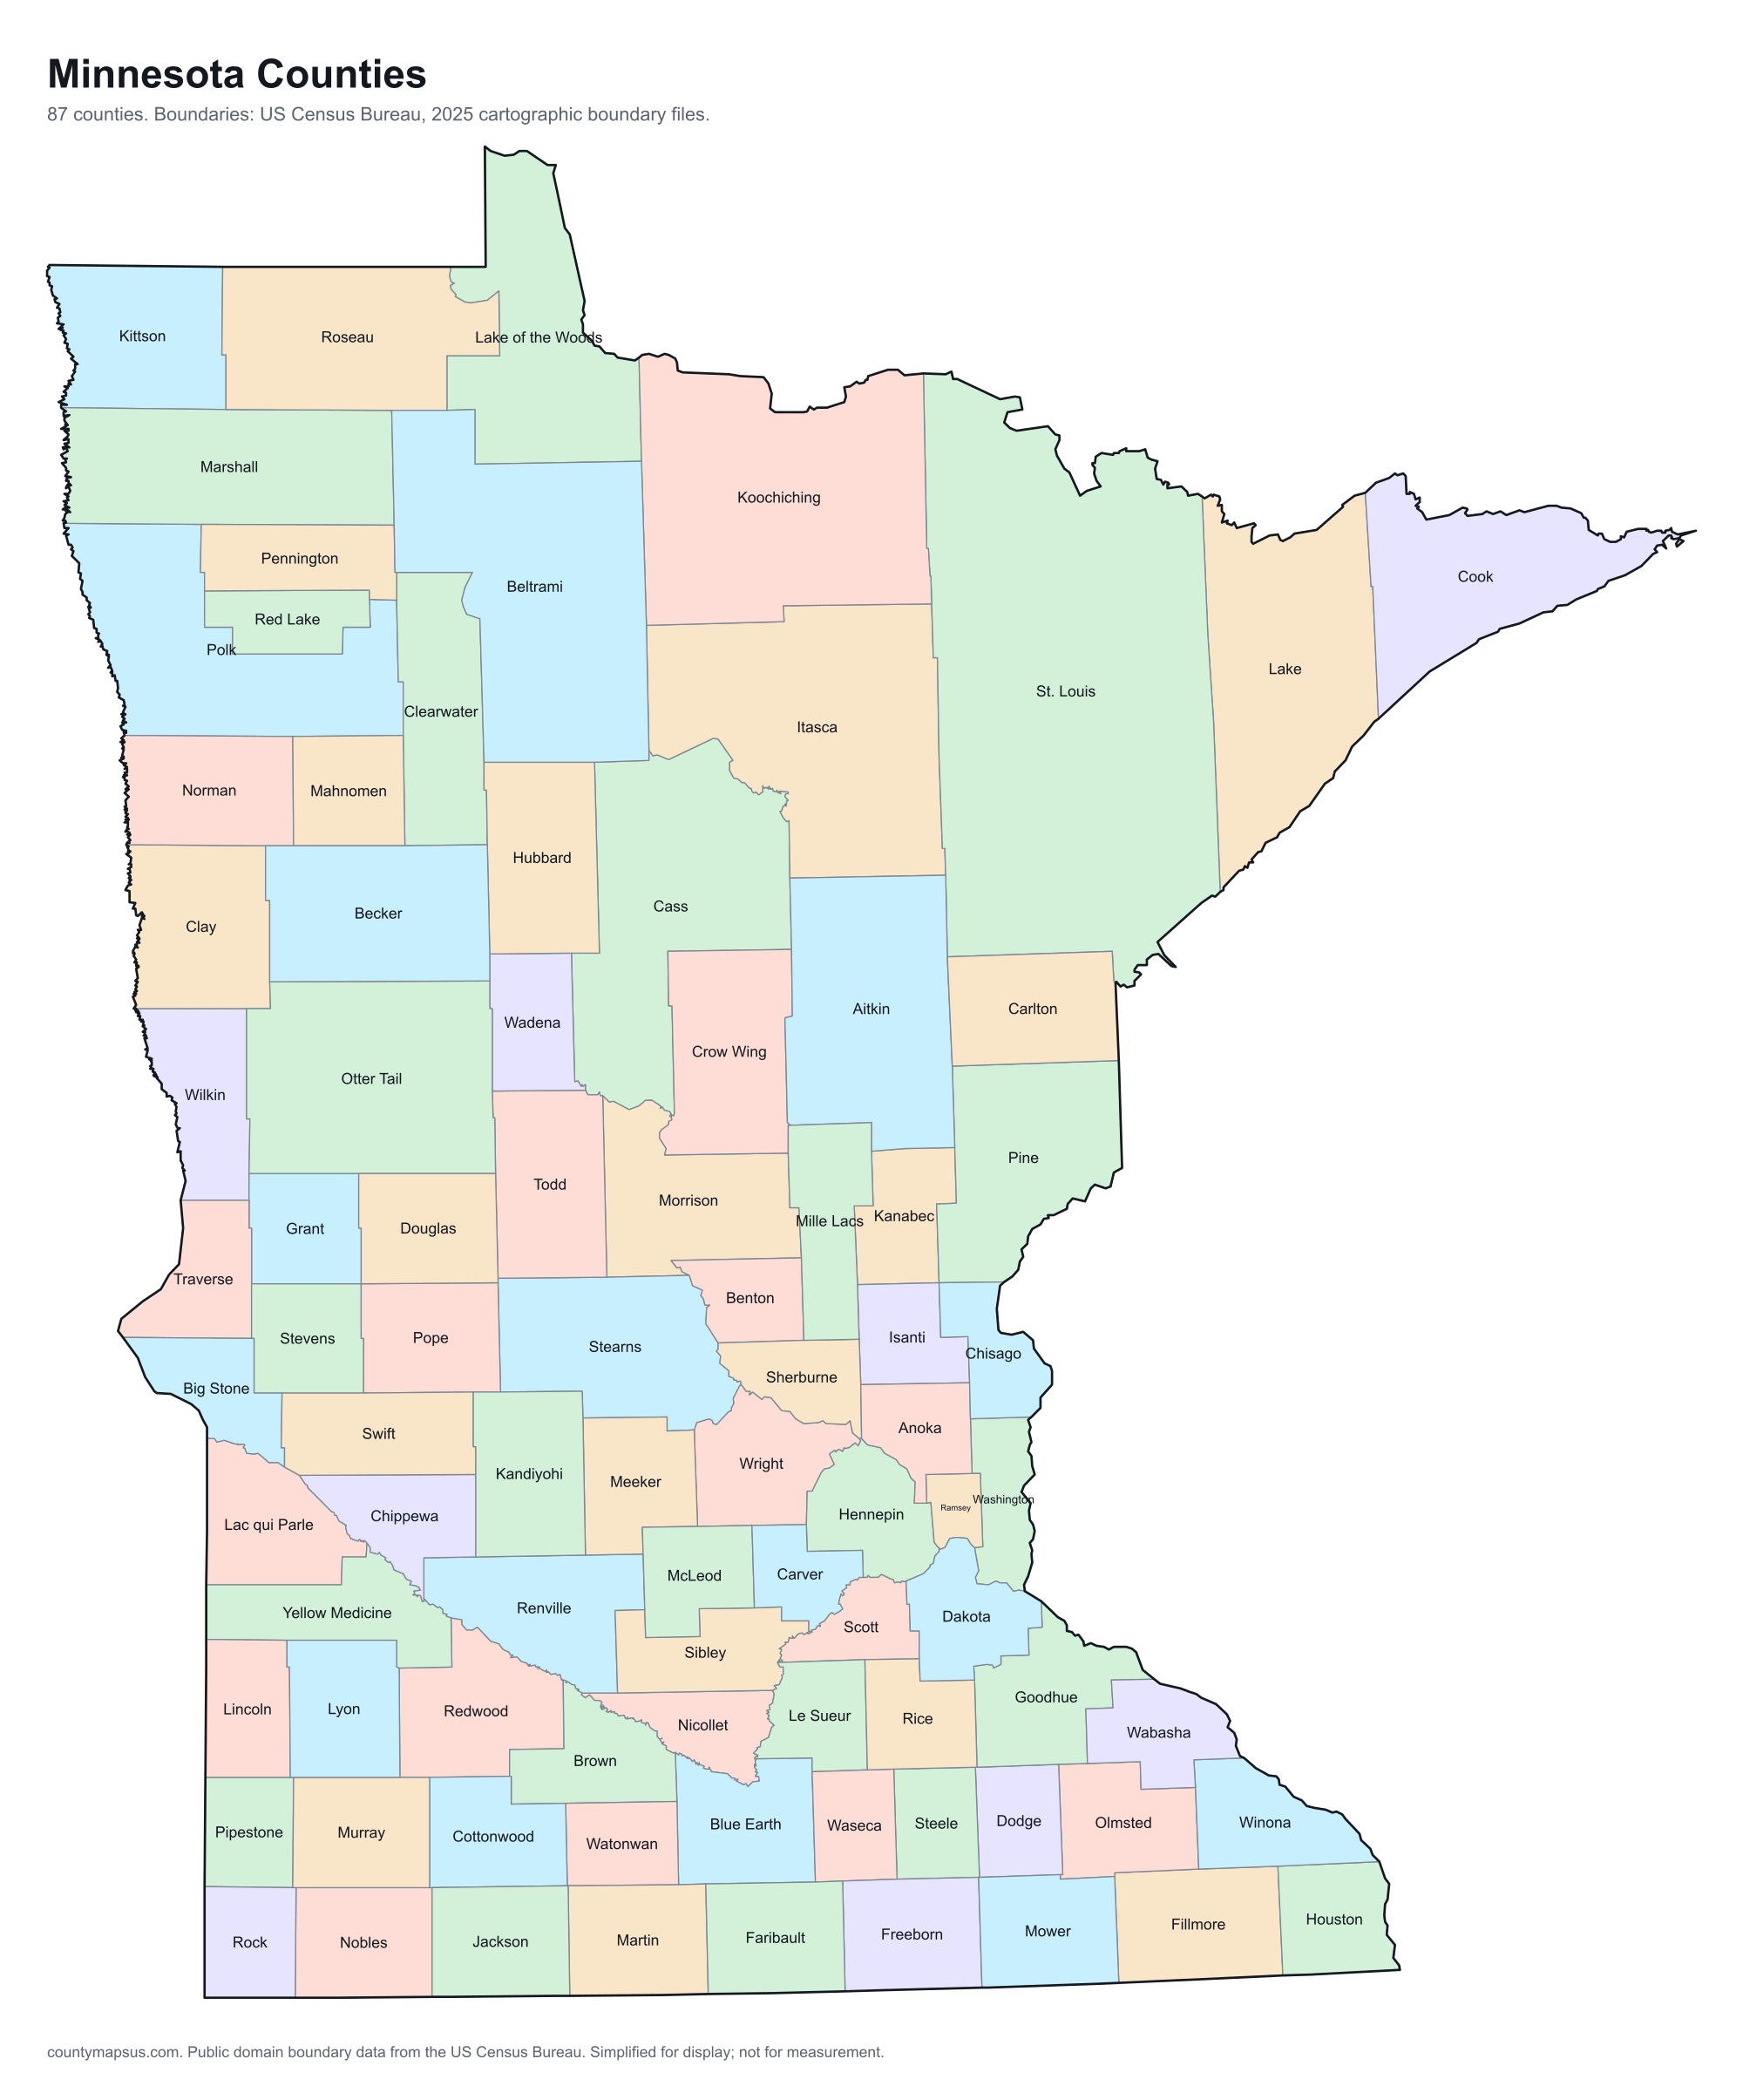
Minnesota has 87 counties. Together they cover 79,632 sq mi of land and 5,830,405 people.
- Population
- Land area
- Density
Neighbouring areas are given different colours so their shared borders read clearly. These colours carry no data.
Population from the Vintage 2025 estimates. Breaks are quintiles within Minnesota.
People per square mile, computed from population and land area. Breaks are quintiles within Minnesota.
Median household income, American Community Survey 2020 to 2024 five-year estimates. Breaks are quintiles within Minnesota.
- Counties
- 87
- 14th most of the 51 states and DC
- Population
- 5,830,405
- 22nd largest
- Land area
- 79,632
- square miles
- Density
- 73.2
- people per square mile, computed
Sources: US Census Bureau, Population Estimates Program, Vintage 2025 Population Estimates, released 26 March 2026; US Census Bureau, Gazetteer Files, 2025 Gazetteer Files, released 10 September 2025. Retrieved 30 August 2026.
Download this map
Free to use and redistribute. The boundaries are public-domain Census Bureau data; attribution to County Maps US is appreciated but not required.
Satellite view
Aerial imagery of Minnesota with the state boundary drawn on top. County lines are not drawn here: at this scale they would bury the picture, and the map above already carries them.
The extremes of Minnesota
Which is the largest county in Minnesota? The answer depends on whether you mean area or population.
The counties, by shape
Every one, drawn to its own scale so the small ones stay recognisable. Shape alone is not a size comparison; the table below carries the areas.
- Aitkin
- Anoka
- Becker
- Beltrami
- Benton
- Big Stone
- Blue Earth
- Brown
- Carlton
- Carver
- Cass
- Chippewa
- Chisago
- Clay
- Clearwater
- Cook
- Cottonwood
- Crow Wing
- Dakota
- Dodge
- Douglas
- Faribault
- Fillmore
- Freeborn
- Goodhue
- Grant
- Hennepin
- Houston
- Hubbard
- Isanti
- Itasca
- Jackson
- Kanabec
- Kandiyohi
- Kittson
- Koochiching
- Lac qui Parle
- Lake
- Lake of the Woods
- Le Sueur
- Lincoln
- Lyon
- Mahnomen
- Marshall
- Martin
- McLeod
- Meeker
- Mille Lacs
- Morrison
- Mower
- Murray
- Nicollet
- Nobles
- Norman
- Olmsted
- Otter Tail
- Pennington
- Pine
- Pipestone
- Polk
- Pope
- Ramsey
- Red Lake
- Redwood
- Renville
- Rice
- Rock
- Roseau
- Scott
- Sherburne
- Sibley
- St. Louis
- Stearns
- Steele
- Stevens
- Swift
- Todd
- Traverse
- Wabasha
- Wadena
- Waseca
- Washington
- Watonwan
- Wilkin
- Winona
- Wright
- Yellow Medicine
What the map does not say
The counties of Minnesota are nowhere near the same size. St. Louis County covers 6,248 sq mi of land, 41.0 times the 152.3 sq mi of Ramsey County. People are spread even less evenly: Ramsey County packs 3,557 per sq mi while Lake of the Woods County holds 2.9 per sq mi.
They were not drawn in one sitting either. Washington County dates to 1849, and the boundaries were still being redrawn when Lake of the Woods County was organised in 1922, 73 years later. Founding years come from Wikidata and are worth checking against the county's own history before citing.
Water is part of the picture too: 56.5% of Cook County is water, the most in the state, which is why its land area and total area disagree. And 34 of the 87 counties here share their names with counties in other states, so searching by name alone can land in the wrong place; the A to Z index lists every duplicate.
All 87 counties of Minnesota
Sortable on any column. This table doubles as the text alternative to the map above: every area is a link, in alphabetical order, whether or not the map renders.
| Name | Population | Land area | Density | Median income | Seat | FIPS |
|---|---|---|---|---|---|---|
| Aitkin County | 16,252 | 1,821 sq mi | 8.9 per sq mi | $60,833 | Aitkin | 27001 |
| Anoka County | 381,605 | 422 sq mi | 904 per sq mi | $101,869 | Anoka | 27003 |
| Becker County | 35,497 | 1,315 sq mi | 27.0 per sq mi | $71,388 | Detroit Lakes | 27005 |
| Beltrami County | 47,055 | 2,505 sq mi | 18.8 per sq mi | $68,975 | Bemidji | 27007 |
| Benton County | 41,744 | 408.3 sq mi | 102 per sq mi | $74,410 | Foley | 27009 |
| Big Stone County | 5,054 | 499.1 sq mi | 10.1 per sq mi | $70,400 | Ortonville | 27011 |
| Blue Earth County | 70,634 | 747.8 sq mi | 94.5 per sq mi | $74,477 | Mankato | 27013 |
| Brown County | 25,517 | 611.1 sq mi | 41.8 per sq mi | $69,378 | New Ulm | 27015 |
| Carlton County | 36,711 | 861.2 sq mi | 42.6 per sq mi | $80,573 | Carlton | 27017 |
| Carver County | 114,379 | 353.9 sq mi | 323 per sq mi | $125,946 | Chaska | 27019 |
| Cass County | 31,430 | 2,021 sq mi | 15.5 per sq mi | $68,874 | Walker | 27021 |
| Chippewa County | 12,406 | 581.2 sq mi | 21.3 per sq mi | $71,458 | Montevideo | 27023 |
| Chisago County | 59,142 | 414.9 sq mi | 143 per sq mi | $99,400 | Center City | 27025 |
| Clay County | 67,734 | 1,045 sq mi | 64.8 per sq mi | $81,172 | Moorhead | 27027 |
| Clearwater County | 8,647 | 999 sq mi | 8.7 per sq mi | $64,475 | Bagley | 27029 |
| Cook County | 5,522 | 1,453 sq mi | 3.8 per sq mi | $72,638 | Grand Marais | 27031 |
| Cottonwood County | 11,405 | 640 sq mi | 17.8 per sq mi | $72,941 | Windom | 27033 |
| Crow Wing County | 69,132 | 998.5 sq mi | 69.2 per sq mi | $72,589 | Brainerd | 27035 |
| Dakota County | 457,710 | 562.6 sq mi | 814 per sq mi | $106,318 | Hastings | 27037 |
| Dodge County | 21,376 | 439.4 sq mi | 48.6 per sq mi | $95,739 | Mantorville | 27039 |
| Douglas County | 40,120 | 636.9 sq mi | 63.0 per sq mi | $79,043 | Alexandria | 27041 |
| Faribault County | 13,888 | 712.5 sq mi | 19.5 per sq mi | $66,815 | Blue Earth | 27043 |
| Fillmore County | 21,540 | 861.3 sq mi | 25.0 per sq mi | $77,512 | Preston | 27045 |
| Freeborn County | 30,440 | 707.2 sq mi | 43.0 per sq mi | $71,023 | Albert Lea | 27047 |
| Goodhue County | 48,195 | 756.7 sq mi | 63.7 per sq mi | $84,171 | Red Wing | 27049 |
| Grant County | 6,085 | 547.8 sq mi | 11.1 per sq mi | $73,917 | Elbow Lake | 27051 |
| Hennepin County | 1,284,784 | 554 sq mi | 2,319 per sq mi | $97,653 | Minneapolis | 27053 |
| Houston County | 18,400 | 552.1 sq mi | 33.3 per sq mi | $79,825 | Caledonia | 27055 |
| Hubbard County | 22,369 | 926 sq mi | 24.2 per sq mi | $71,995 | Park Rapids | 27057 |
| Isanti County | 44,386 | 435.8 sq mi | 102 per sq mi | $87,440 | Cambridge | 27059 |
| Itasca County | 45,404 | 2,667 sq mi | 17.0 per sq mi | $68,603 | Grand Rapids | 27061 |
| Jackson County | 9,857 | 703 sq mi | 14.0 per sq mi | $75,743 | Jackson | 27063 |
| Kanabec County | 16,628 | 521.6 sq mi | 31.9 per sq mi | $71,460 | Mora | 27065 |
| Kandiyohi County | 44,720 | 797.4 sq mi | 56.1 per sq mi | $76,592 | Willmar | 27067 |
| Kittson County | 4,031 | 1,099 sq mi | 3.7 per sq mi | $76,100 | Hallock | 27069 |
| Koochiching County | 11,587 | 3,105 sq mi | 3.7 per sq mi | $66,940 | International Falls | 27071 |
| Lac qui Parle County | 6,704 | 765 sq mi | 8.8 per sq mi | $74,432 | Madison | 27073 |
| Lake County | 10,746 | 2,109 sq mi | 5.1 per sq mi | $75,541 | Two Harbors | 27075 |
| Lake of the Woods County | 3,770 | 1,298 sq mi | 2.9 per sq mi | $77,546 | Baudette | 27077 |
| Le Sueur County | 29,453 | 448.8 sq mi | 65.6 per sq mi | $94,968 | Le Center | 27079 |
| Lincoln County | 5,583 | 536.8 sq mi | 10.4 per sq mi | $69,694 | Ivanhoe | 27081 |
| Lyon County | 25,684 | 714.4 sq mi | 36.0 per sq mi | $75,303 | Marshall | 27083 |
| Mahnomen County | 5,153 | 557.9 sq mi | 9.2 per sq mi | $59,441 | Mahnomen | 27087 |
| Marshall County | 8,798 | 1,775 sq mi | 5.0 per sq mi | $72,543 | Warren | 27089 |
| Martin County | 19,440 | 712.3 sq mi | 27.3 per sq mi | $59,507 | Fairmont | 27091 |
| McLeod County | 36,631 | 491.5 sq mi | 74.5 per sq mi | $80,084 | Glencoe | 27085 |
| Meeker County | 23,603 | 608 sq mi | 38.8 per sq mi | $75,446 | Litchfield | 27093 |
| Mille Lacs County | 27,753 | 572.3 sq mi | 48.5 per sq mi | $72,729 | Milaca | 27095 |
| Morrison County | 34,620 | 1,125 sq mi | 30.8 per sq mi | $69,446 | Little Falls | 27097 |
| Mower County | 40,971 | 711.3 sq mi | 57.6 per sq mi | $73,074 | Austin | 27099 |
| Murray County | 7,942 | 704.7 sq mi | 11.3 per sq mi | $74,033 | Slayton | 27101 |
| Nicollet County | 34,273 | 448.5 sq mi | 76.4 per sq mi | $79,756 | St. Peter | 27103 |
| Nobles County | 22,338 | 715.1 sq mi | 31.2 per sq mi | $66,101 | Worthington | 27105 |
| Norman County | 6,336 | 872.8 sq mi | 7.3 per sq mi | $72,260 | Ada | 27107 |
| Olmsted County | 166,731 | 653.5 sq mi | 255 per sq mi | $95,406 | Rochester | 27109 |
| Otter Tail County | 61,041 | 1,972 sq mi | 31.0 per sq mi | $72,255 | Fergus Falls | 27111 |
| Pennington County | 13,686 | 616.5 sq mi | 22.2 per sq mi | $77,325 | Thief River Falls | 27113 |
| Pine County | 30,472 | 1,411 sq mi | 21.6 per sq mi | $71,146 | Pine City | 27115 |
| Pipestone County | 9,260 | 465.1 sq mi | 19.9 per sq mi | $69,628 | Pipestone | 27117 |
| Polk County | 30,545 | 1,971 sq mi | 15.5 per sq mi | $73,107 | Crookston | 27119 |
| Pope County | 11,420 | 674.6 sq mi | 16.9 per sq mi | $76,220 | Glenwood | 27121 |
| Ramsey County | 541,623 | 152.3 sq mi | 3,557 per sq mi | $81,568 | Saint Paul | 27123 |
| Red Lake County | 3,940 | 432.4 sq mi | 9.1 per sq mi | $77,188 | Red Lake Falls | 27125 |
| Redwood County | 15,265 | 878.6 sq mi | 17.4 per sq mi | $67,866 | Redwood Falls | 27127 |
| Renville County | 14,356 | 982.9 sq mi | 14.6 per sq mi | $70,625 | Olivia | 27129 |
| Rice County | 69,939 | 495.8 sq mi | 141 per sq mi | $83,181 | Faribault | 27131 |
| Rock County | 9,524 | 482.5 sq mi | 19.7 per sq mi | $71,295 | Luverne | 27133 |
| Roseau County | 15,246 | 1,672 sq mi | 9.1 per sq mi | $74,474 | Roseau | 27135 |
| Scott County | 159,017 | 356.1 sq mi | 447 per sq mi | $119,314 | Shakopee | 27139 |
| Sherburne County | 104,194 | 432.9 sq mi | 241 per sq mi | $105,466 | Elk River | 27141 |
| Sibley County | 15,356 | 589 sq mi | 26.1 per sq mi | $77,634 | Gaylord | 27143 |
| St. Louis County | 200,518 | 6,248 sq mi | 32.1 per sq mi | $70,069 | Duluth | 27137 |
| Stearns County | 164,110 | 1,343 sq mi | 122 per sq mi | $77,066 | St. Cloud | 27145 |
| Steele County | 37,464 | 429.6 sq mi | 87.2 per sq mi | $84,196 | Owatonna | 27147 |
| Stevens County | 9,747 | 563.7 sq mi | 17.3 per sq mi | $75,733 | Morris | 27149 |
| Swift County | 9,763 | 742 sq mi | 13.2 per sq mi | $60,412 | Benson | 27151 |
| Todd County | 26,060 | 945.1 sq mi | 27.6 per sq mi | $67,662 | Long Prairie | 27153 |
| Traverse County | 3,130 | 573.9 sq mi | 5.5 per sq mi | $62,989 | Wheaton | 27155 |
| Wabasha County | 21,537 | 523 sq mi | 41.2 per sq mi | $82,007 | Wabasha | 27157 |
| Wadena County | 14,388 | 536.3 sq mi | 26.8 per sq mi | $61,467 | Wadena | 27159 |
| Waseca County | 18,688 | 423.4 sq mi | 44.1 per sq mi | $76,261 | Waseca | 27161 |
| Washington County | 286,895 | 384.8 sq mi | 746 per sq mi | $115,345 | Stillwater | 27163 |
| Watonwan County | 11,459 | 434.9 sq mi | 26.3 per sq mi | $71,699 | St. James | 27165 |
| Wilkin County | 6,288 | 751 sq mi | 8.4 per sq mi | $71,410 | Breckenridge | 27167 |
| Winona County | 50,523 | 626.2 sq mi | 80.7 per sq mi | $70,744 | Winona | 27169 |
| Wright County | 157,559 | 661.2 sq mi | 238 per sq mi | $107,209 | Buffalo | 27171 |
| Yellow Medicine County | 9,477 | 759.1 sq mi | 12.5 per sq mi | $74,000 | Granite Falls | 27173 |
Sources: US Census Bureau, Population Estimates Program, Vintage 2025 Population Estimates, released 26 March 2026; US Census Bureau, Gazetteer Files, 2025 Gazetteer Files, released 10 September 2025; US Census Bureau, American Community Survey, American Community Survey 2020-2024 5-Year Estimates, released 29 January 2026; Wikidata (CC0), Wikidata. Retrieved 30 August 2026.
The ten most populous
- Hennepin County1,284,784
- Ramsey County541,623
- Dakota County457,710
- Anoka County381,605
- Washington County286,895
- St. Louis County200,518
- Olmsted County166,731
- Stearns County164,110
- Scott County159,017
- Wright County157,559
Data on this page last rebuilt 30 August 2026. How these figures are produced.